8.1 Energy sources
8.1 Energy Sources
Outline:
Understandings:
- Specific energy and energy density of fuel sources
- Sankey diagrams
- Primary energy sources
- Electricity as a secondary and versatile form of energy
- Renewable and non-renewable energy sources
Applications and skills:
- Solving specific energy and energy density problems
- Sketching and interpreting Sankey diagrams
- Describing the basic features of fossil fuel power stations, nuclear power
- stations, wind generators, pumped storage hydroelectric systems and solar power cells
- Solving problems relevant to energy transformations in the context of these generating systems
- Discussing safety issues and risks associated with the production of nuclear power
- Describing the differences between photovoltaic cells and solar heating panels
Notes:
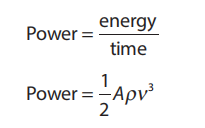
Specific energy and energy density
Specific energy ESP
is how much energy (J) you can get per unit mass (kg) from a fuel. Its units are jkg^- .
Energy density ED
is how much energy (J) you can get per unit volume (m^3 ). Its units are Jm^-3 .
Example
EXAMPLE: Fission of each uranium-235 produces 3.510-11 J of energy. The density of U-235 is 1.8104 kg m-3. Calculate the ESP and the ED of U-235.
SOLUTION:
(a) m = (235 u)(1.661×10⁻²⁷ kg u-1) = 3.90×10⁻²⁵ kg.
ESP = 3.5×10⁻¹¹ J / 3.90×10⁻²⁵ kg = 9.0×10¹³ J kg-1.
(b) ED = (9.0×10¹³ J kg-1)(1.8×10⁴ kg m-3)
= 1.6×10¹⁸ J m-3.
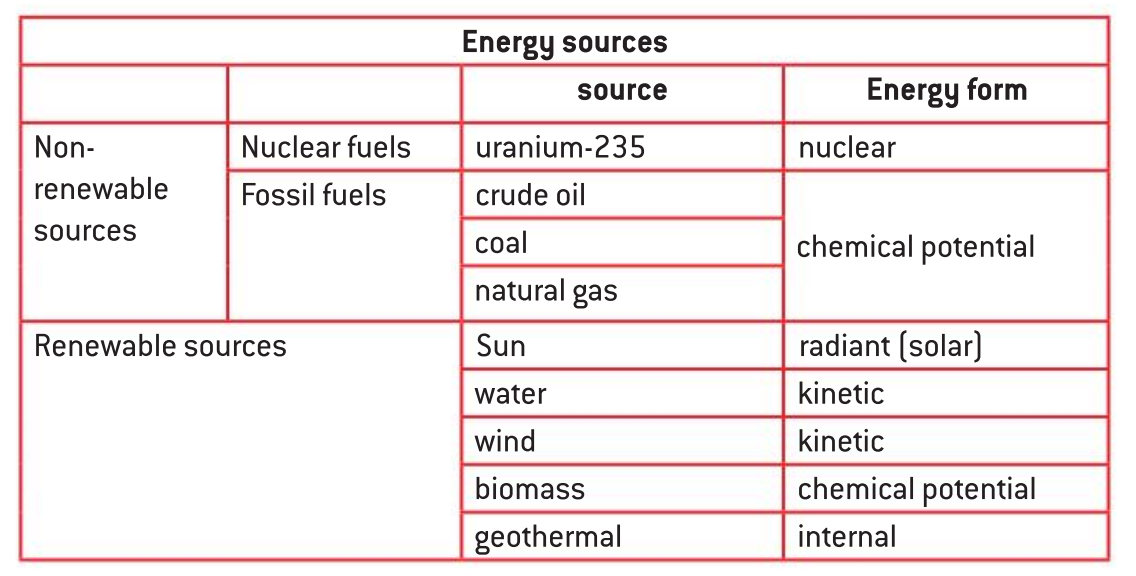
Types of energy sources
Pirmary source
Which has not been transformed or converted before use by the consumer.
Secondary source
Which results from the transformation of a primary source.
Renewable source
Which can be replenished in relatively short times (on the scale of a human lifetime)
Non-renewable source
Which can be replaced but only over very long geological times.
A good way to classify renewable and non-renewable resources is by the rates at which they are being consumed and replaced.
Sankey Diagram
There are some rules to remember about the Sankey diagram:
- Each energy source and loss in the process is represented by an arrow.
- The diagram is drawn to scale with the width of an arrow being proportional to the amount of energy it represents.
- The energy flow is drawn from left to right.
- When energy is lost from the system it moves to the top or bottom of the diagram.
- Power transfers as well as energy flows can be represented
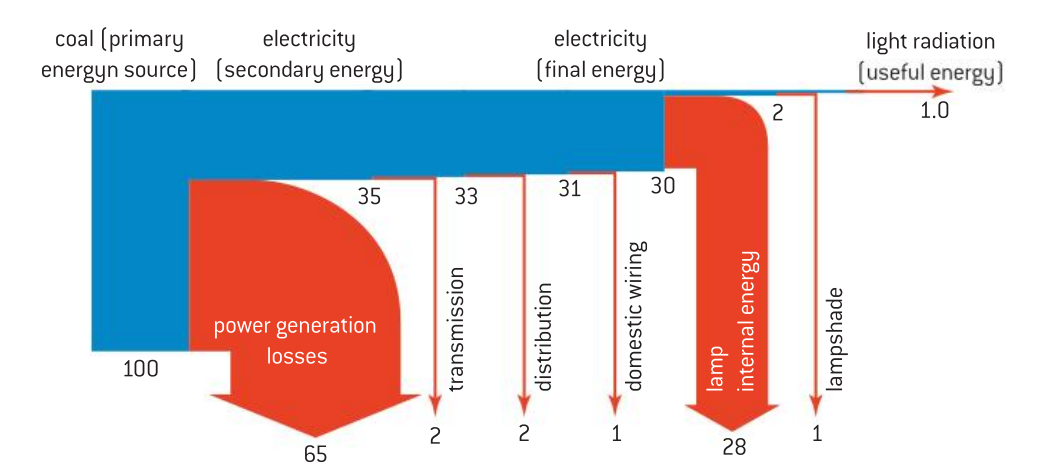
It is important to recognize that in any process where there is an energy transformation, this energy is "lost" and is no longer available to perform a useful job. This is degraded energy and there is always a loss of energy like this in all energy transfers.
Pimary energy
Fossil energy
Fuel used includes coal, oil, and natural gas. The gas and oil can be burnt readily in a combustion chamber that is thermally connected to the boiler, while coal is crushed into a ne powder before being blown into the furnace where it is burnt.
Disadvantages:
- The materials have taken a very large time to accumulate and will not be replaced for equally long times.
- The burning of the fuels releases into the atmosphere large quantities of carbon dioxide, and has a major impact on the response of the atmospheric system to the radiation incident on it from the Sun (the greenhouse and enhanced greenhouse effects).
- A need for transport leads to an overall reduction in the efficiency of the process because energy has to be expended in moving the fuels to the power stations.